A 10-Year Analysis of Rental Building Expenses vs. RTA Maximum Allowable Rent Increase
Repeatedly, governments have tried to solve the problem of housing by trying to control demand. Rent controls and other restrictions have been around since the 1970’s and have never worked to alleviate the issues. These tactics only serve to band-aid the rental housing environment in the short term while ignoring and more critically undermining the only true long-term solution; increasing the supply of rental housing sufficiently large enough to drive prices down. Such is the case with the current debate over the Residential Tenancy Act (RTA) maximum allowable annual increase of 4.5% for 2019.
The 2019 RTA maximum annual increase is based upon the 12-month average BC Consumer Price Index (CPI) for the period August 2017 through July 2018 (calculated to be 2.5%) plus, 2% for a total of 4.5%. Based upon data from BC Stats*, during this same period the average wage growth for workers in British Columbia was 4.6%, and 6.22% on average in the past six months.
* https://www2.gov.bc.ca/gov/content/data/statistics/people-population-community/income/wage-rate-info
The rental market in British Columbia is served by a broad constituency of responsible, long-term rental housing providers who are invested in the community and genuinely committed to the provision of safe, secure, sustainable rental housing for BC families. This critical service can only continue if landlords are able to recover the costs and associated risks of providing rental homes. The harsh reality under rent controls is that the allowable maximum annual rent increase formula has been consistently inadequate when weighed against the primary expenses a landlord incurs on an annual basis.
We would add that while the public and government focus on the current year’s allowable increase, it should be noted that over the past ten years, the allowable maximum rent increases under the RTA’s rent control formula have fluctuated (depending on CPI inflation for each year) and has been as low as 2.20% in 2014 and 2.30% in 2011. As a result, over the ten years from 2009-2018, the compound annual maximum allowed rent increase has been only 3.2%. Keep in mind that the RTA rent control formula sets a maximum cap on rent increases. It is by no means a guaranteed increase.
Spoiler Alert! Total Rental Operating Expenses for 2009 – 2018
have increased +7.6% per annum
LandlordBC represents in the order of 3300 owners and managers of rental housing in BC. We have undertaken an expense analysis of a purpose-built rental building in Metro Vancouver integrating invoiced figures provided by the member owner of the building analyzed. The analysis attempts to illustrate how much higher the actual operating expense of this typical purpose-built rental building have increased over a 10-year period compared to the maximum allowable rent increase under the RTA rent control formula of 2% + CPI during that same period of time.
SAMPLE BUILDING
The sample purpose-built rental building is:
- Mid-sized three storey wood-frame built in the late 1970s
- Suburban Metro Vancouver location.
- Well-maintained by long-term owner-managers who have re-invested in the property with large capital expenditures over time.
THE DATA
We have taken the raw data of operating expenses and transformed each line item (expenses as well as the typical rent of a typical suite) to an index with a base of 100.00 in the starting year 2009. This makes it easier to illustrate in charts and compare the changes over time by removing scale effects. Also, using an index (rather than actual dollar amounts) anonymizes the data so that we can publish the charts. We’ve used $1,000 for the rent of a typical suite in 2009 then increased it every year (and compounded) by the RTA maximum allowed rent increase for each year. Again, the rent is turned into an index with a base of 100.00 in 2009.
We have highlighted the main cost driver line items that have increased the most during the sample period:
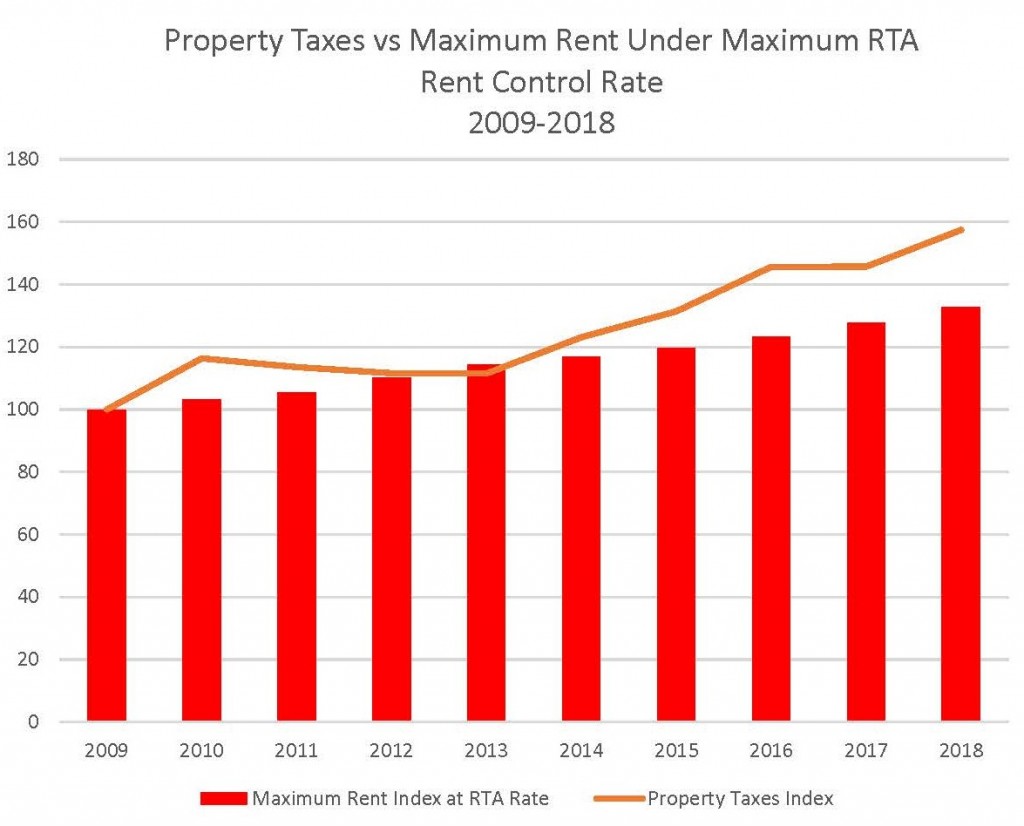
- Property taxes
- Insurance
- Water & Sewer
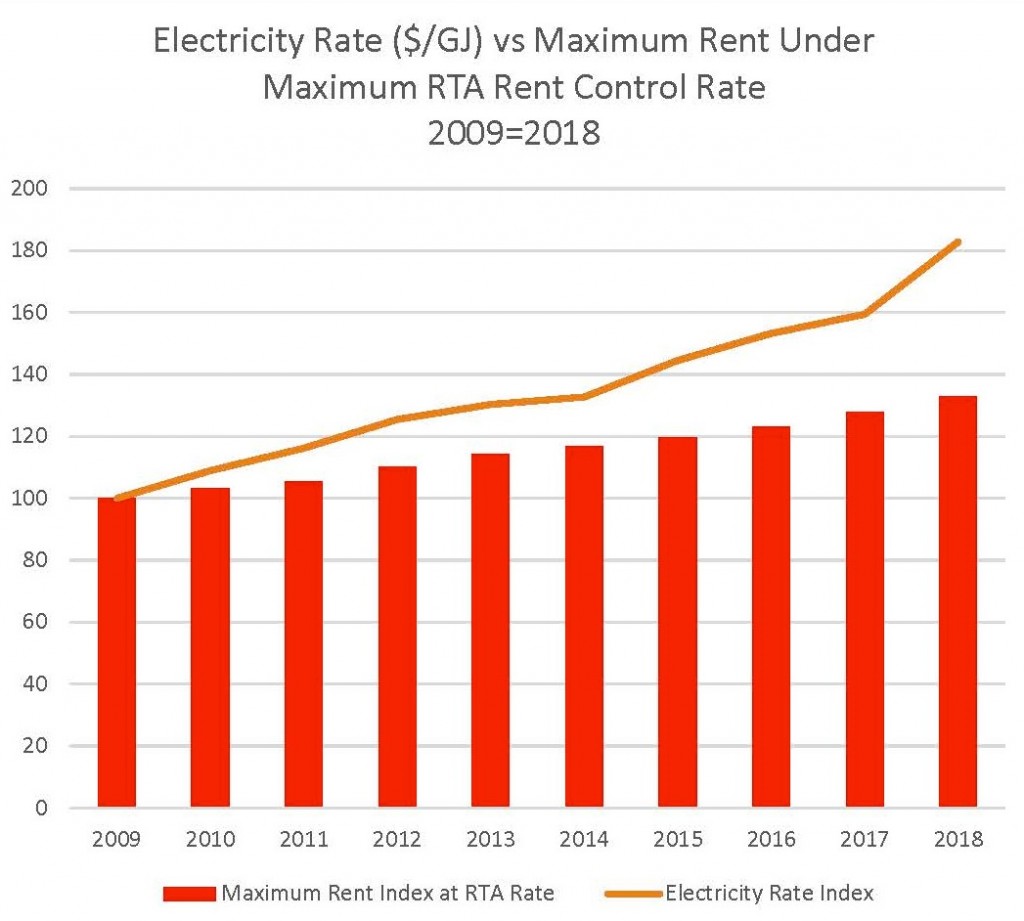
- Electricity (note: this building is an all electric building, no natural gas)
- Repairs & Maintenance
OPERATING EXPENSES FAR EXCEED RTA MAXIMUM ALLOWED RENT INCREASE
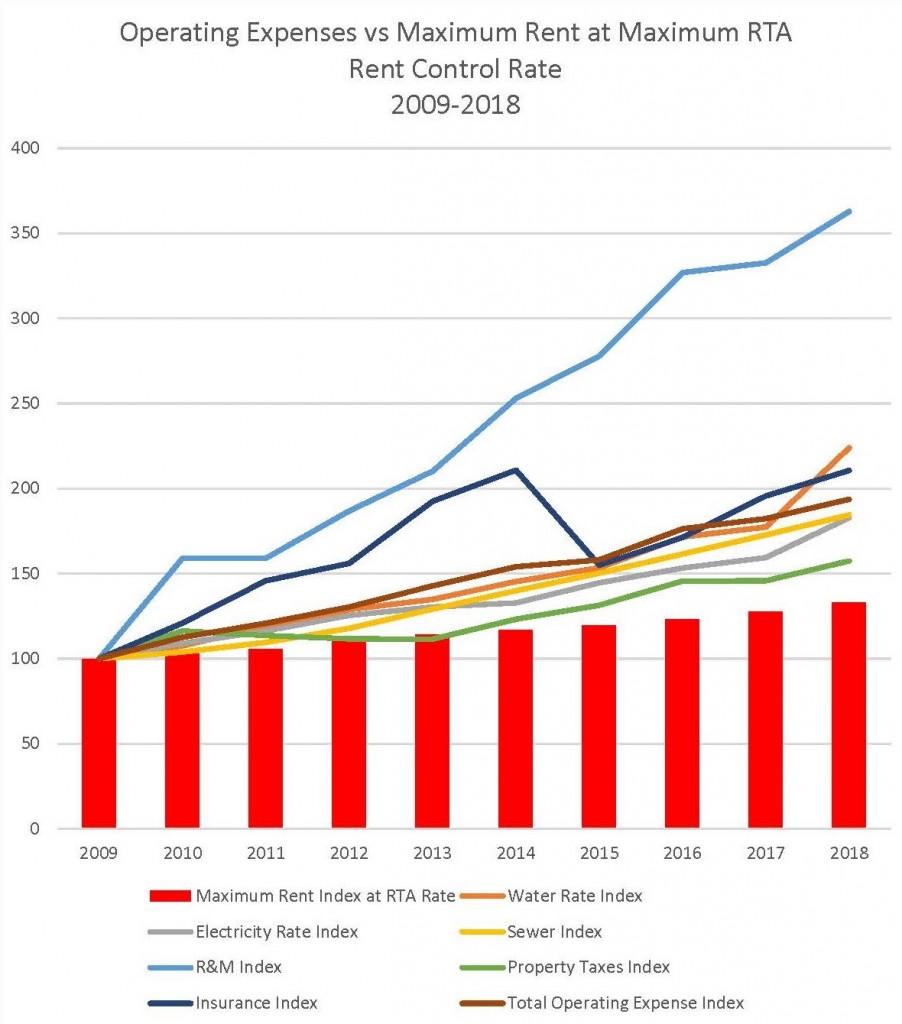
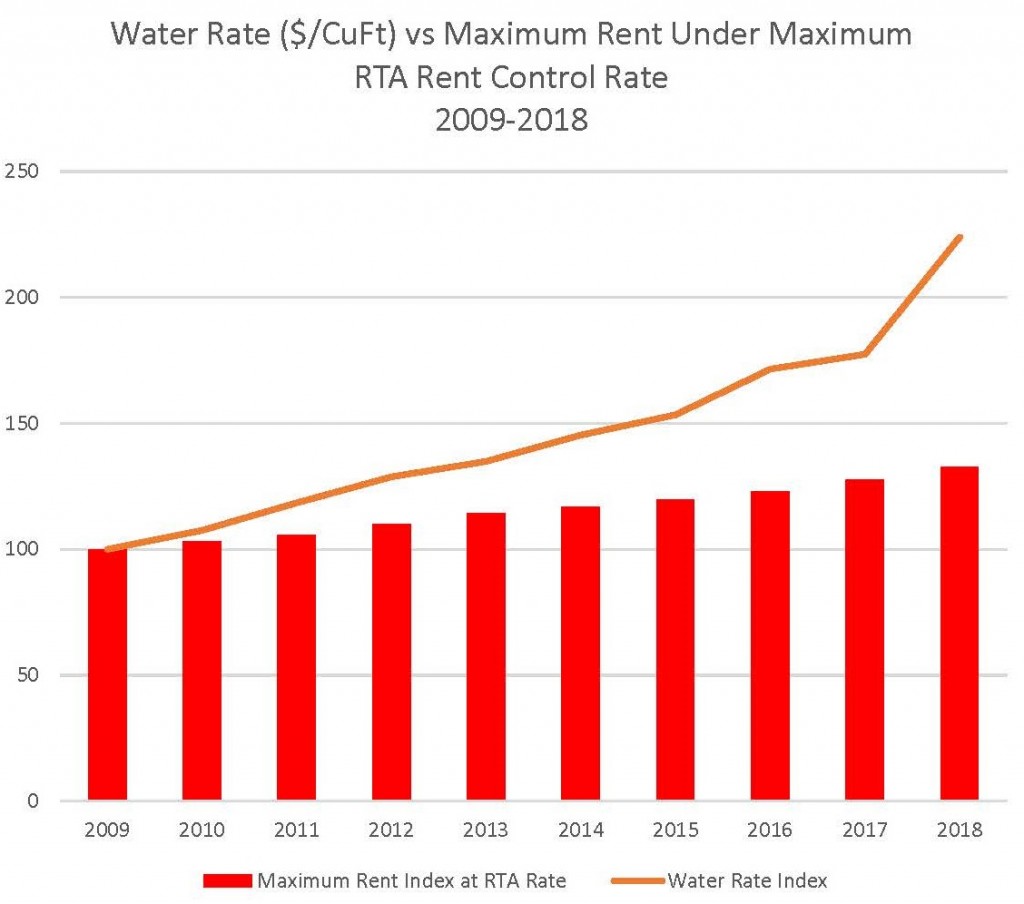
The first chart below combines all the above main cost drivers as well as the total operating expenses over the period 2009-2018 and compares their increases with the rent of a typical suite increased at the maximum allowable rate under the RTA. We have used bright red columns to highlight the rent index over time. They clearly show how the rent growth under the RTA maximum allowable rent control rate is far lower than all the main cost drivers as well as far lower than the increase in total operating expenses.
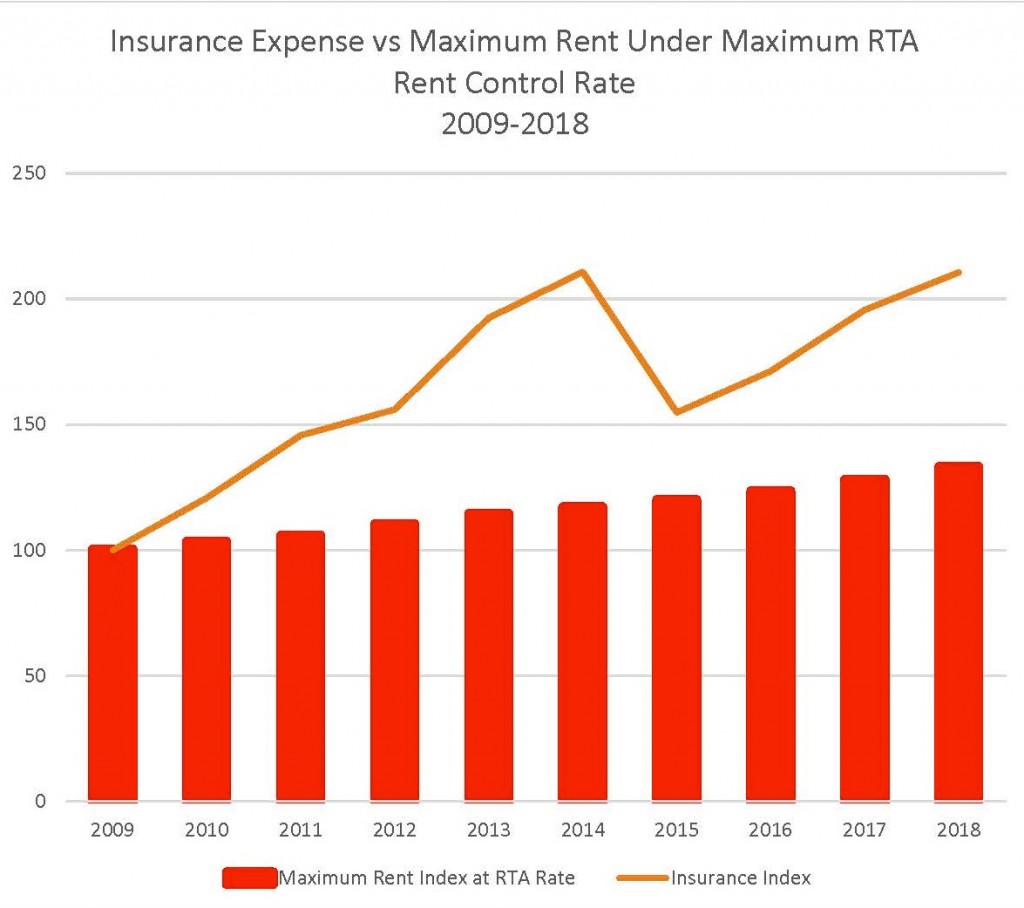
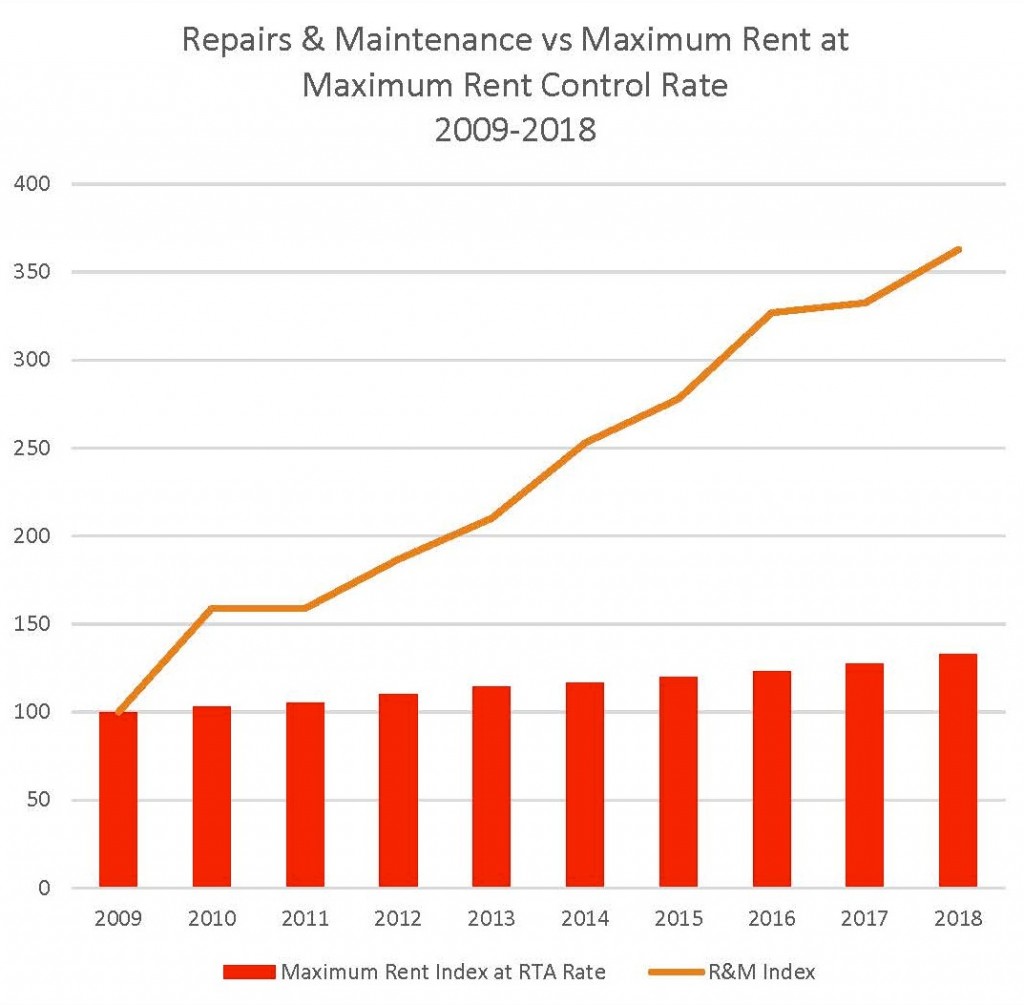
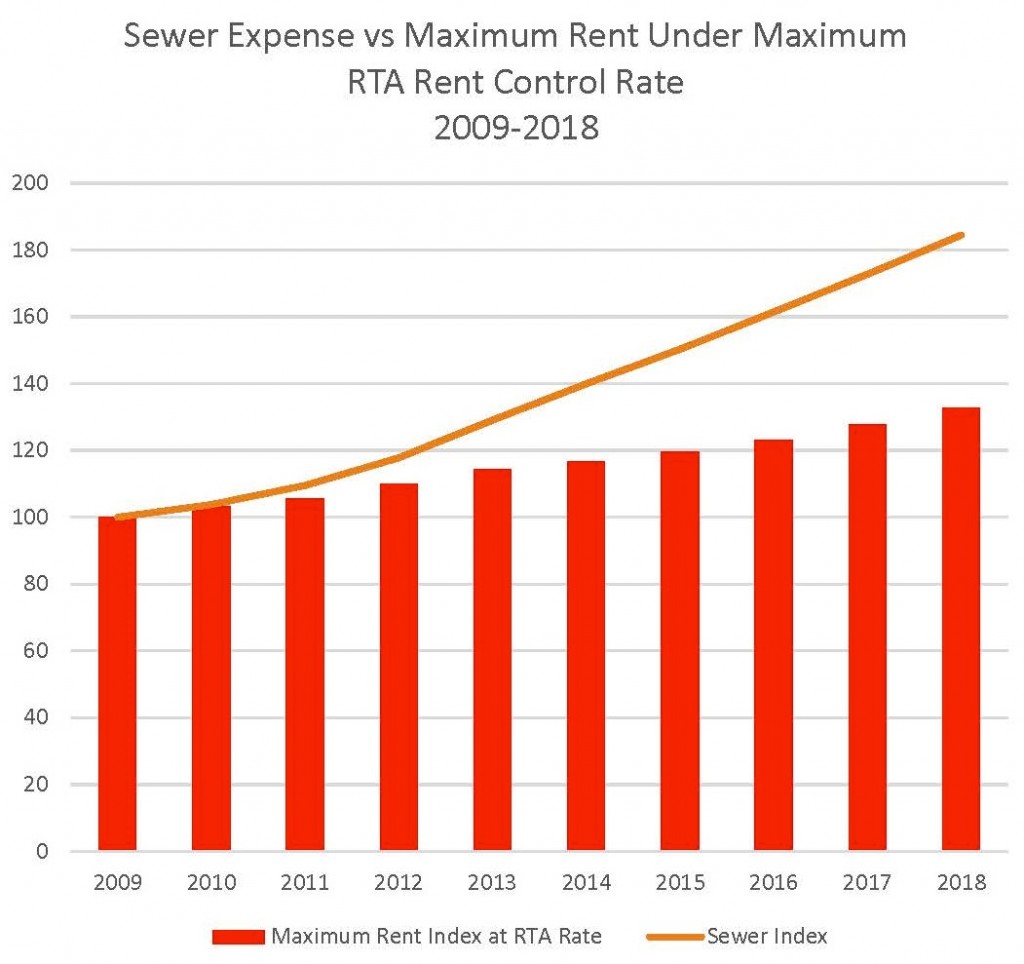
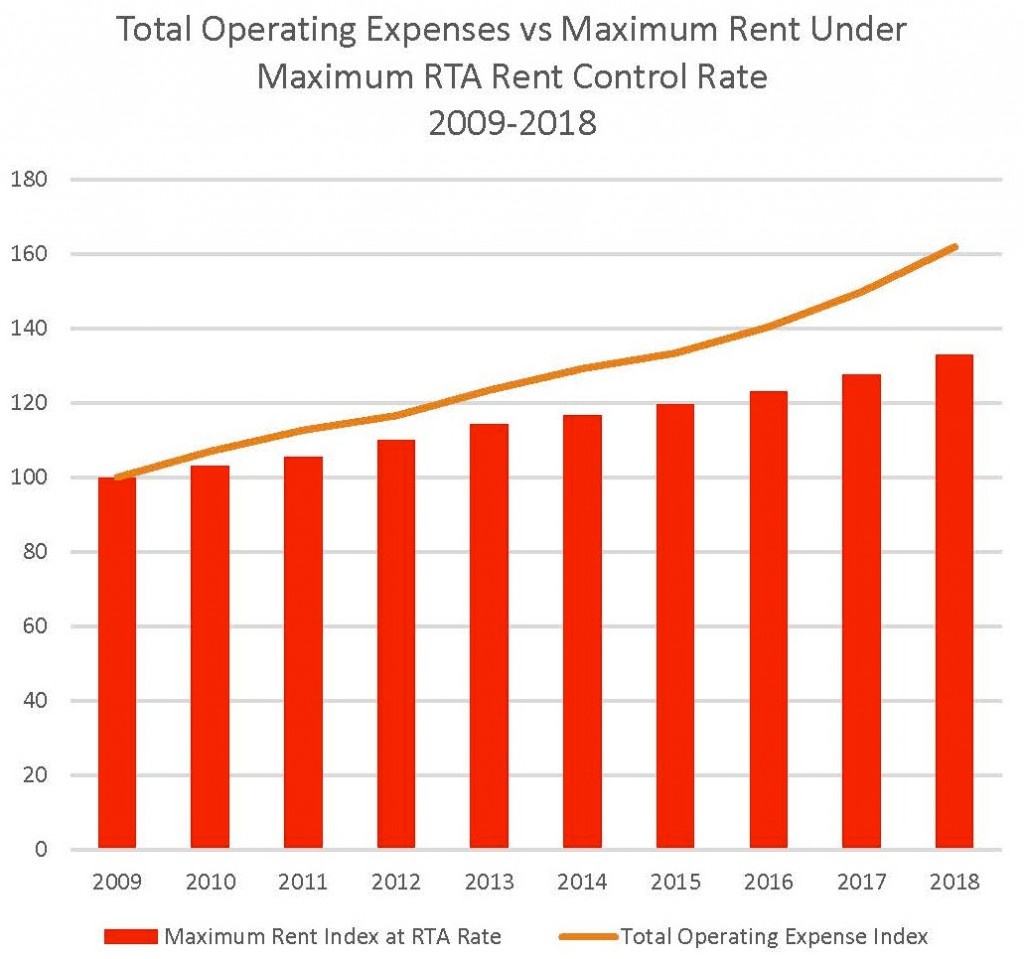
The subsequent charts isolate each individual operating cost item versus the rent of a typical suite increased at the maximum allowable rent increase under the RTA’s rent control formula (red columns). The final chart shows the increase in total operating expenses versus the rent of a typical suite increased at the maximum allowable rent control rate.
The data show that while the rent only grew at a compound annual growth rate (CAGR) of 3.2% under the RTA rent control formula, costs grew at far higher rates. Examples:
- Repairs & Maintenance (R&M) +15.4% per annum
- Water Rate ($/CuFt) +9.4% per annum
- Insurance +8.6% per annum
- Sewer +7.0% per annum
- Total Operating Expenses +7.6% per annum